Quality Control
Quality control (QC) of metagenomic short reads is a series of procedures that check the accuracy, reliability, and suitability of data from metagenomic studies for further analysis. In the case of metagenomics, QC is very important for distinguishing real biological signals from technical problems. Effective QC makes the results of later analyses, such as assembly and binning, more reliable.
The key steps of quality control are
-
Trimming: Eliminate primer and adapter sequences and remove low-quality bases from the end of reads or entire low-quality reads.
-
Length Filtering: Remove reads that are too short after trimming.
-
Host DNA Removal: Remove contaminant sequences (e.g. mouse, human).
In addition, the Toolkit provides a way to estimate the sequencing effort necessary to theoretically retrieve all genomes, with Nonpareil.
Metagenomics-Toolkit
The Metagenomics-Toolkit offers a tool for each of the aforementioned categories. You will now execute the following Toolkit configuration:
| QC Configuration File Snippet 1 | |
|---|---|
1 2 3 4 5 6 7 8 9 10 11 12 13 14 15 16 17 18 19 20 21 22 23 24 25 26 27 28 29 30 31 32 33 34 35 36 37 38 39 40 41 42 43 44 45 46 47 48 49 50 51 52 53 54 | |
Task 1
You saw the introduction part of the tutorial regarding the structure of the config file. Can you tell which tools or methods are executed in the QC part?
Solution
Fastp, nonpareil, filterHuman
The following configuration runs the tools
Task 2
Copy the following command to execute the Toolkit. The Toolkit will need about 3 to 5 minutes to complete.
cd ~/mgcourse/

NXF_VER=25.04.2 nextflow run metagenomics/metagenomics-tk \
      -profile standard \
      -params-file https://raw.githubusercontent.com/metagenomics/metagenomics-tk/refs/heads/master/default/tutorials/tutorial1/fullpipeline_qc.yml \
      -ansi-log false \
      -entry wFullPipeline \
      --input.paired.sheet https://raw.githubusercontent.com/metagenomics/metagenomics-tk/refs/heads/master/test_data/tutorials/tutorial1/reads.tsv \
      --logDir logs_qc
In the following we will inspect the outputs of the mentioned tools.
Output
Fastp
Fastp is an efficient, versatile, open-source tool for preprocessing FASTQ files and quality control in next-generation sequencing (NGS) workflows. Written in C++, fastp provides high-speed performance without compromising accuracy, making it suitable for handling large sequencing data sets. For quality and adapter trimming fastp trims reads from 5’ end to 3’ end using a sliding window.
If the mean quality of bases inside a window drops below a specific q-score, the remainder of the read will be trimmed. If a read gets too short during this trimming, it will be discarded.
Quality Report
The Metagenomics-Toolkit allows you to run fastp by only reporting the quality of the data. This way you can easily inspect the data
before actually further processing it. You can do this by setting the reportOnly parameter to true in the config below.
Task 3
You can view the fastp output in the qc output directory:
ls -1 output/data/1/qc/*/fastp/
which results in the following output:
data_fastp.json
data_fastp_summary_after.tsv
data_fastp_summary_before.tsv
data_interleaved.qc.fq.gz
data_report.html
data_unpaired.qc.fq.gz
data_unpaired_summary.tsv
The fastp output for your data can be viewed here. Since the data that you are using during this tutorial is simulated, we will inspect the fastp output of a real dataset. The following fastp output belongs to a wastewater sequencing project: Wastewater Fastp Output.
Task 4
How many reads of the wastewater dataset passed the filter? Between which quality score ranges does the read1 FASTQ file fall before and after QC.
Solution
78.752339% of the reads passed the filter. The quality score for read1 ranges between 29 and 36 before filtering and after QC between 35 and 36.
Host DNA Removal
The Toolkit provides the SRA human-scrubber tool that uses a k-mer based approach to search for human sequences against a k-mer database using human reference sequences.
Task 5
You can find the result of the tool in the filterHuman directory: The output of the tool are the filtered sequences, and it also includes statistics about the sequences before and after filtering.
ls output/data/1/qc/*/filterHuman/
The following command tells you how many sequences are left after filtering:
column -t -s$'\t' output/data/1/qc/*/filterHuman/data_interleaved_summary_after.tsv
The num_seqs column tells you the number of sequences.
How many reads were removed after filtering?
Solution
Only 6 reads were removed, which are most likely false positives.
Nonpareil
Nonpareil provides an estimate of what to expect from a dataset. Through a redundancy analysis of the reads, you get an estimate of the average genome coverage and the sequencing effort required to theoretically retrieve all genomes. In addition, Nonpareil provides a diversity estimate based solely on the read data.
Task 6
You can view the Nonpareil output in the following directory:
ls -1 output/data/1/qc/*/nonpareil/
The output of ls is the following:
data.npa
data.npc
data.npl
data_nonpareil_curves.pdf
data_nonpareil_index.tsv
The data_nonpareil_curves.pdf contains the Nonpareil curve for the dataset:
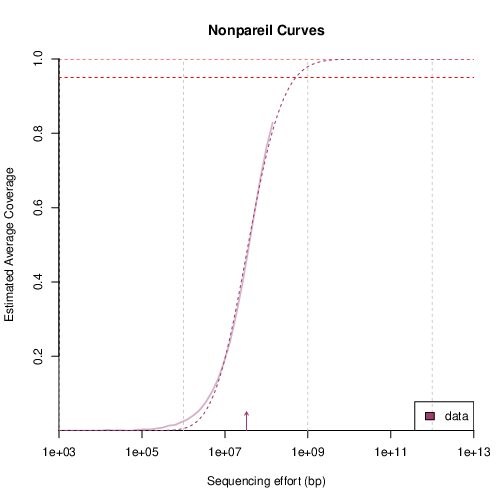
The Nonpareil curves show the fit of coverage per sequencing effort to a sigmoidal model.
The lines indicate coverage estimates from subsampling (solid) and Nonpareil projection curves (dashed), and the lower-end arrows indicate the sequence diversity.
Horizontal red dashed lines indicate 95 and 99% coverage.
You can obtain the estimated average coverage for a given sequencing effort by inspecting the rightmost point of the solid line.
Sequencing Diversity Arrow
The arrow that displays the sequencing diversity in the plot is only useful when comparing to other sequencing diversity arrows.
Task 7
From the plot, it is hard to get the exact numbers (e.g. average coverage for a given sequencing effort) and does not provide the diversity estimate.
Instead of looking into the plot it is easier to check the data_nonpareil_index.tsv file. In the Toolkit wiki we provide an explanation for the columns provided by Nonpareil. View the file in order to get the following information:
-
The estimated genome coverage for the current sequencing effort
-
The diversity estimate.
Solution
You can view the file by using cat or column
column -t -s$'\t' output/data/1/qc/*/nonpareil/data_nonpareil_index.tsv
With the help of the wiki you can get the questioned values:
-
Estimated genome coverage for the current sequencing effort: 80%
-
Diversity Estimate: 17.3